

Service maturity model
In Fig. 1, in order to quantify the maturity of services, this study needs to evaluate services from multiple dimensions. Each service iterates continuously with the requirements, and each iteration cycle needs to go through the following three stages: development testing, operation and maintenance online, and online operation. At each stage, a series of measures are needed to ensure the final maturity and reliability of the service. This study focuses on each stage and identifies the indicators that need to be addressed to measure the overall quality of that stage. This study comprehensively rated the above three stages and graded service maturity based on the ratings. (1–5 points are classified as admission level, 6–7 points are classified as service level, and 8–10 points are classified as maturity level.) Through such a service maturity model, this study can intuitively evaluate the maturity of a service using quantitative indicators and identify areas for improvement.

Full-link microservice security link topology.
Low item sorting
Based on the service maturity model, this study evaluated multiple backend services and found that some indicator items generally scored lower in each service. These indicators include: development testing: code specification, unit testing, stress testing, interface testing; In terms of operation and maintenance online: grayscale online, online rollback; In terms of online availability: system protection, data backup, alarm processing, and emergency plans. Therefore, this study prioritized the optimization schemes for these low sub items, hoping to improve the maturity of services and elevate the services of this study to a mature level through the optimization of low sub items.
Low sub item optimization plan
In Fig. 2a,b, The services in this study are mainly developed based on the Java language, mainly using virtual machine deployment and a small amount of container deployment. So the optimization plan below mainly revolves around the current service status of this study.
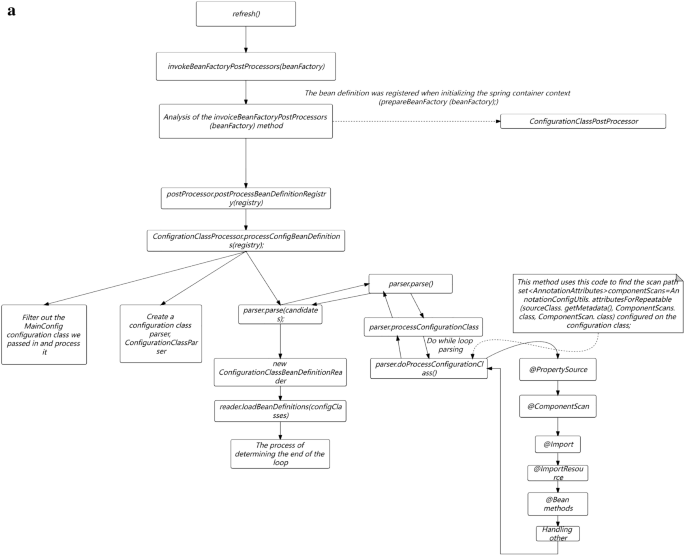
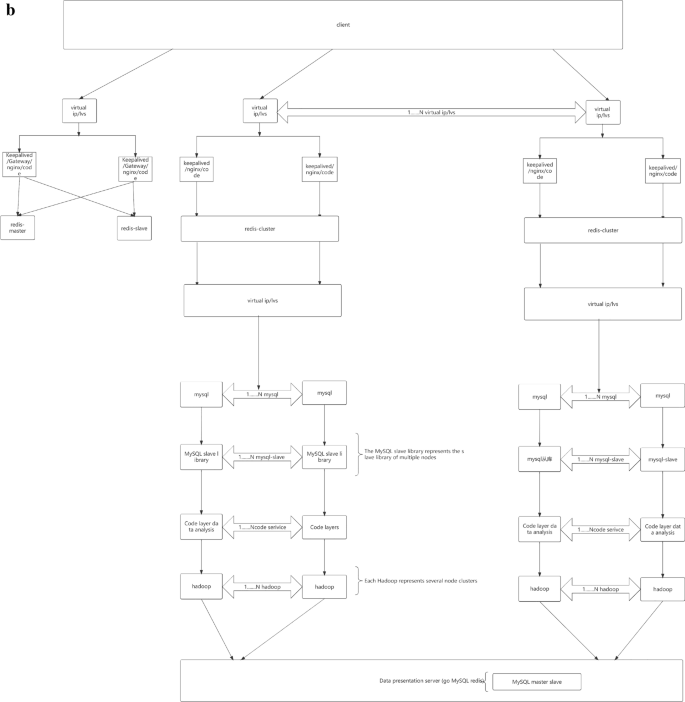
(a) Full link testing core routing. (b) Full Link Metaverse Cloud Native Data Business Logic Flow View.
Development testing
Online bugs are often introduced by developing new requirements. If problems are discovered as much as possible during the development and testing phase, improving code quality can minimize the impact of the problem. Here are some common measures and means during the development and testing phase:
Code specification
Programming style. Collaborating with GitLab CI and Sonar inspections, it is possible to conduct code specification checks on each submission and present them visually in the form of reports.
Unit testing
In Fig. 2a,b, Unit testing is located at the bottom of the testing pyramid. Fast running efficiency, typically completed test cases run for no more than 10 min, and can be integrated into the CI process to quickly provide feedback on issues. Low maintenance costs, unit testing can detect problems during the development phase, and repair costs are low. The longer the feedback time for testing the pyramid, the higher the cost of implementation. Therefore, it is recommended to increase the coverage of unit testing.
The most commonly used testing framework for Java is Junit. In addition, in conjunction with the Mock testing library Mockito and the testing coverage tool Jacobo, a complete set of unit testing tools is formed. Jacco plugins can be configured in both IDEA and SonarQube to visually display the coverage of unit testing.
In the process of promoting unit testing, the common problems encountered in this study are: supplementing unit testing for projects is time-consuming and laborious, and how to control the testing coverage of new code?
In Fig. 3, the solution of this study is to prioritize supplementing unit testing for important code (such as public libraries and tool classes) with existing code. Indicators for increasing Code coverage of new code (e.g., set the test coverage of new code to be no less than 90%); As new code is added and old code is modified, the overall testing coverage of the project will gradually increase. Add code testing coverage statistics: Using the diff cover tool, you can calculate the testing coverage of the current branch’s modified code by analyzing branch code differences and Jacob test reports.
Optimization of core branch business timing.
Unit testing
-
(1)
Why do I need to do stress testing Through stress testing, this study was able to: identify performance bottlenecks; Estimate resource usage; Provide reference for current limiting configuration; Identify issues introduced by new requirements.
-
(2)
What functions should stress testing tools have Common stress testing tools include JMeter and others. This study uses the LoadMaker cloud pressure testing system provided by mainstream cloud platforms in the financial field of first tier large enterprises, which has the following characteristics: multiple pressure clusters, and the pressure can reach high levels; Create and save pressure testing scenarios, repeat execution; Provide pressure test reports: QPS, response time, error rate, and other data; Meanwhile, in order to ensure that pressure testing does not affect the actual traffic of online users, this study constructed a separate pressure testing resource pool. When pressure testing is required, selecting machines and pressure testing modules in the resource pool can automatically build a pressure testing environment.
-
(3)
When is pressure testing required? Routine pressure testing: Conduct routine pressure testing on key projects during the grayscale period of the version; Pre launch pressure testing for new projects/interfaces: Pre launch pressure testing for new projects to guide capacity estimation and current limiting configuration.
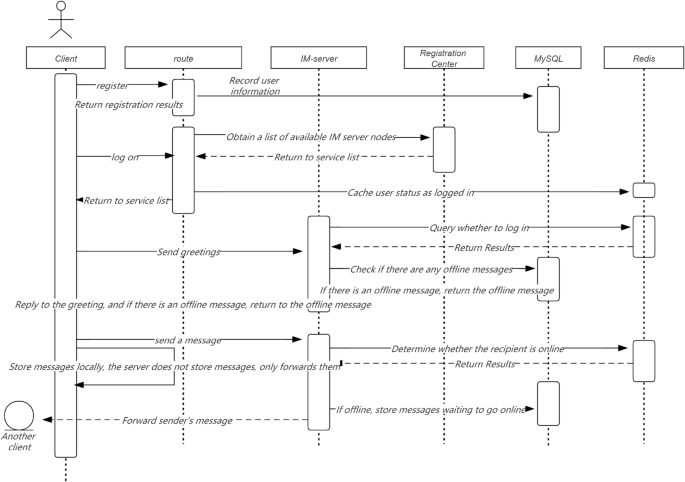
Interface dial test
In Fig. 4, for backend interface services, this study is more concerned about whether the data returned by the online interface is correct and whether the new code has affected the existing logic? Interface testing can effectively cover the above two issues. On the one hand, it can be used for verifying the data returned by online interfaces and detecting interface anomalies in real-time. On the other hand, it can be used to automate the API testing, cooperate with the online process, find out whether the new code is introduced, and terminate the online operation in a timely manner. An interface testing system should have the following features: support verifying the interface return results; Complex verification supports writing scripts; Multiple test points can be set to simulate formal user request scenarios; Support for alarms; Detailed test reports; Get through with the online process, and support automated API testing after grayscale.

Full link security performance testing.
Operation and maintenance launch
Grayscale online mechanism
Passing code testing in a testing environment does not guarantee that the code has no problems at all, and there is still a possibility of undetected problems caused by testing omissions or environmental differences. If there is no grayscale online mechanism, these potential issues can directly go online, which may have catastrophic consequences for the online system. The grayscale launch needs to be accompanied by grayscale checks to ensure the safety of this launch. The inspection methods used in this study include: automatic interface detection for grayscale machines after grayscale is brought online; Compare the monitoring indicators of grayscale machines with those of online machines; Acceptance of grayscale environment testing function.
Online rollback
If an online problem occurs due to the launch of new code, the first thing to do should be a rollback operation, rather than analyzing the problem and fixing the code launch. The rollback operation needs to achieve the following points as much as possible: the rollback speed is fast, and if it is necessary to reverse the code, recompile and package it, and upload it to the server, the entire process will be relatively long, and the fault recovery time will also be relatively long; Rollback is complete, and some code and configuration files are dependent. If only the code is rolled back, it may cause exceptions after startup; Rollback capability requires architectural consideration to avoid situations where rollback is not possible, such as data writing after going live, which is incompatible with the rolled back code.
This study adopts the RPM packaging method for online and rollback. Package all the content (code and configuration) deployed at once in the form of RPM. During deployment, the server retains the historical version of the RPM package. When rollback is required, simply execute the Job to install the historical version of the RPM package. If the service is deployed using a container, it will be easier to roll back by simply starting the mirror of the historical version.
Online availability
System protection
In Fig. 5, online operation may face various problems, such as machine failures, network issues, dependent service provider crashes, and a surge in traffic. How to survive in such a dangerous environment? We cannot trust others, we can only improve the reliability of our services. The general methods adopted include: circuit breaker, current limiting, degradation, retry, etc.
Full link security and effective timing.
Circuit breaker: When there is a problem with the service provider that this study relies on, the service of this study cannot be dragged down. The commonly used method is circuit breaker. When the success rate of the relying party is lower than the threshold set in this study, pause the call to it and retry after a certain interval. Commonly used fuse components include Hystrix, Sentinel, etc. The following table is a comparison between Hystrix and Sentinel. Considering that Netflix no longer maintains Hystrix and Sentinel has more diverse functions, this study chose Sentinel as the fuse component for this study22,23,24,25,26.
Downgrading: When a sudden accident occurs and the overall service is overloaded, in order to avoid overall unavailability of the service, service degradation is generally enabled to ensure the normal operation of important or basic services, and non important services are delayed or suspended. Therefore, this study implemented a page degradation service. The service will periodically request the page interface and verify it. After passing the verification, the results will be saved; When the service encounters abnormalities or overload, turn on the downgrade switch, and the page service will directly read the previously saved static page data and return it. Sacrifice personalization and downgrade from thousands of people and faces to thousands of people and faces. Due to the removal of the page construction process, the processing power will be greatly improved to ensure the normal operation of the service27,28,29,30,31.
In Fig. 6, current limiting: Current limiting is very important as it is an important level for protecting the normal operation of services. Especially in the event of a sudden increase in traffic, reasonable flow limiting can protect your service from being overwhelmed. If flow restriction is not configured, not only will the service be disrupted during a sudden increase in traffic, but it will also be difficult to recover because the service will be disrupted again after restarting. This study generally configures current limiting at the gateway layer and service layer separately. The gateway layer can configure single machine current limiting using nginx’s current limiting plugin. The service layer uses Sentinel flow limiting. Sentinel can limit traffic based on QPS, concurrency, and call relationships, and supports overall cluster traffic restriction. The following figure shows the implementation of Sentinel cluster current limiting.
Full Link System Security Routing Optimization.
In Fig. 7, Try again: From the client to the backend service, there may be exceptions in various stages, such as DNS failures, operator node failures, backend server failures, etc., resulting in request failures. For different situations, appropriate retries can increase the success rate of requests. There are several types of retries on the mainstream frontline financial industry APP end:
In Fig. 8, IP direct retry, which controls the number of retries by configuring the number of direct IPs; Super pipeline retry, the company’s self-developed HTTP based gateway proxy service, which can achieve remote retry; HTTP retry; Try again with the original URL.
Time series flow native distribution mechanism.
Retries can improve the success rate, but excessive retries may lead to excessive pressure on back-end services and Avalanche effect. So the following points should be noted in the retry strategy: the retry strategy can be cloud controlled, and in extreme cases, it can be configured in the background to turn off retry; Distinguish error codes and try again. Not all error codes need to be tried again, such as error codes returned by backend triggering current limiting, which do not need to be tried again.
Data backup
In terms of database usage, this study needs to consider the high availability of the database. In this regard, the company’s service cloud team has made many optimizations, which can be found in this article. This article will not be elaborated on. As a business unit, it is important to note that the use of databases should strictly follow the architecture of two locations and three centers for application and use.
Monitoring alarms
A comprehensive monitoring and alarm system can enable this study to detect and handle service issues in a timely manner, avoiding their spread. From different latitudes, this study requires different monitoring, mainly including:
Indicator monitoring; The key indicators of monitoring services include three parts: machine indicators (CPU, memory, network traffic, etc.), service indicators (QPS, success rate, response time, etc.), and third-party interface indicators (QPS, success rate, response time, etc.).
The specific implementation plan is to report indicators through Collected and self-developed Meerkat components, submit them to Graphint for summary and storage, and display them through Grafana.
Application log monitoring: Based on application log monitoring, this study can discover more fine-grained exceptions, such as exceptions thrown within the application, internal business logic errors, etc. Firstly, this study defines a format specification for log printing, where all logs that need to be monitored are output in a unified format. Then, through the log collection component Venus, the logs on the machine are delivered to the Kafka queue, and finally entered into the Druid temporal database for multi-dimensional analysis and storage. The front-end report is presented using Graphna17,18,19,20.
Full link monitoring: If you want to monitor contextual link relationships, cross system fault localization, and other related issues, you need to perform full link monitoring. For detailed information, please refer to the article “Exploration and Practice of Full Link Automated Monitoring Platforms in the Financial Field of Mainstream First tier Large Factories” in this article.
Emergency plan
Although a series of availability optimization measures were listed above in this study, various anomalies and failures still occur in real online environments, requiring manual handling in this study. When a problem truly arises, if you go to the scene to think about how to handle it, you may not have achieved the optimal solution due to panic. Therefore, this study needs to anticipate potential issues and how to handle them in advance, and form a written document. When problems arise, this study only needs to process the document step by step21.
Service quality inspection
With an optimization plan in place, how can I determine if the service has been implemented according to the optimization plan? How to ensure high long-term availability of services? This study does not want to complete a round of optimization. After the service maturity is improved, if there is no follow-up for a long time, the service maturity will gradually begin to decline.
Therefore, automated checks were conducted on these common service maturity indicators, and daily health reports were generated to monitor the maturity of services. Once there is an abnormality in a certain indicator, this study can handle it in a timely manner. This keeps the service maturity of this study in a long-term stable state.